Introduction
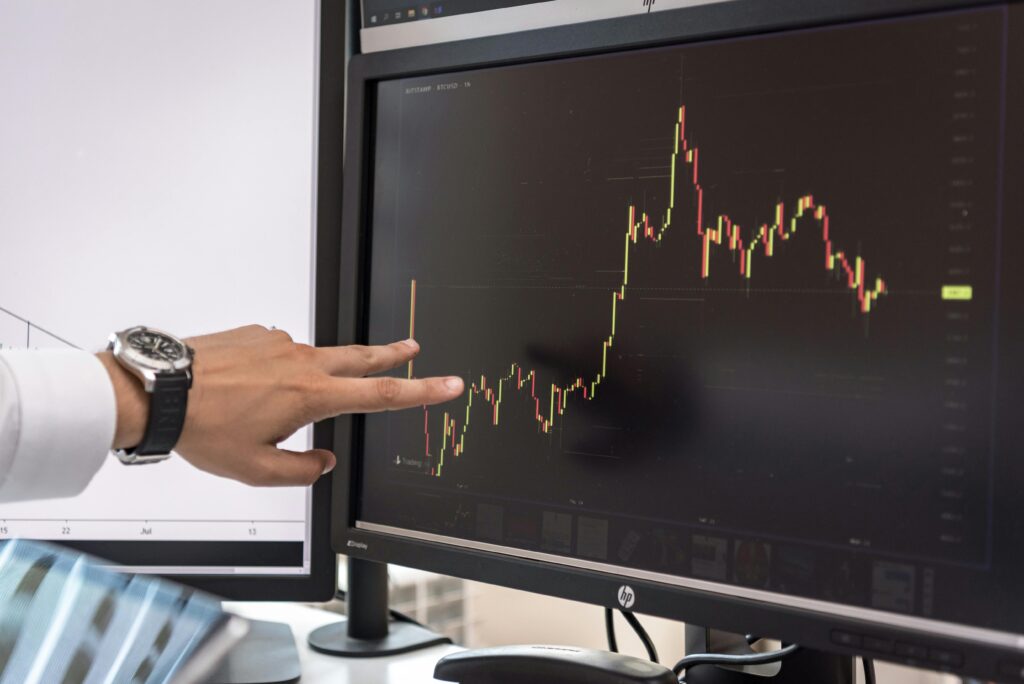
Crypto prices go up and down fast, and charts help you understand these moves. Here’s how to read them in 2025.
1. Candlesticks
Green = price went up.
Red = price went down.
Each candlestick shows price changes in a time frame.

2. Timeframes
Charts can show 1 minute, 1 day, or 1 week. Traders choose based on their style.
3. Support and Resistance
- Support: Price level where coins usually stop falling.
- Resistance: Price level where coins usually stop rising.
4. Volume
Shows how much crypto is being traded. More volume = stronger trend.

5. Trends
- Bullish: Prices generally going up.
- Bearish: Prices generally going down.

Conclusion
Price charts aren’t magic, but they help you make smarter buying and selling decisions.